
")
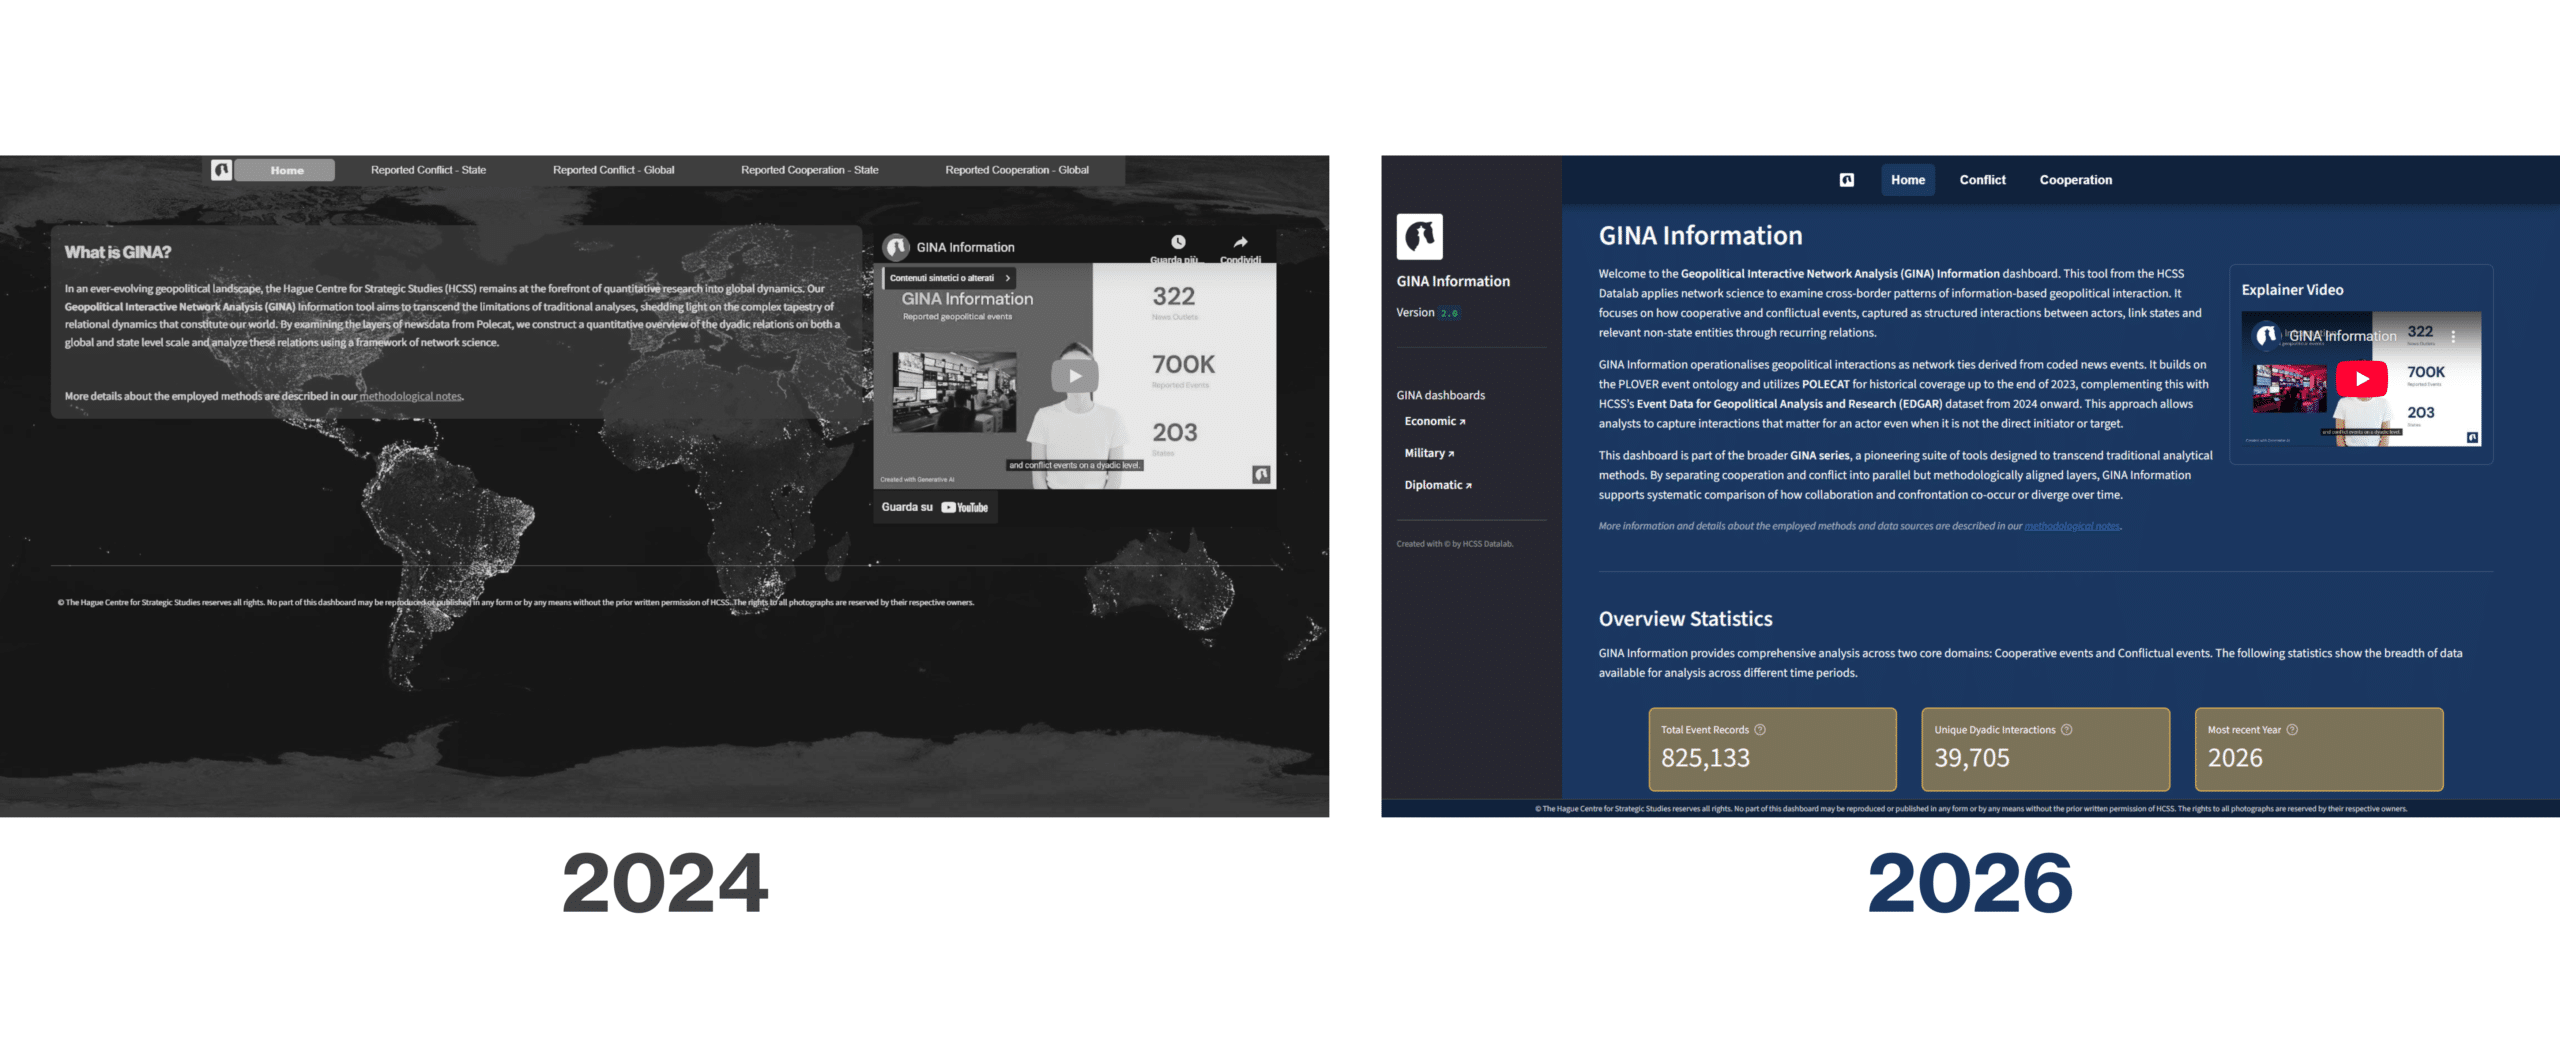
Following the relaunch of GINA Diplomatic and GINA Economic, and the release of GINA Military 2.0 last week, HCSS concludes the rollout of its next-generation Geopolitical Interactive Network Analysis (GINA) suite with the launch of GINA Information 2.0. As the final domain in the GINA series introduced in late 2024, this platform completes the unified methodological framework across diplomatic, military, economic, and information dimensions.
GINA Information captures both verbal and material cooperation and conflict events, allowing users to analyse geopolitical signalling based on news data and to explore the latent dynamics of cooperation and contestation that often precede measurable outcomes. Rather than focusing solely on more ‘traditional’ indicators such as number of casualties, economic flows, or arms transfer, the tool enables policy-makers, researchers, and analysts to examine how states communicate, coordinate, compete, and contest narratives through observable geopolitical events on a dyadic level. Built on event data structured around the PLOVER ontology and drawing on POLECAT (historical coverage through 2018-2023) alongside HCSS’s EDGAR dataset (from 2024 onward), the platform applies network science to map relational structures shaping the international information environment at the global and state level scale.
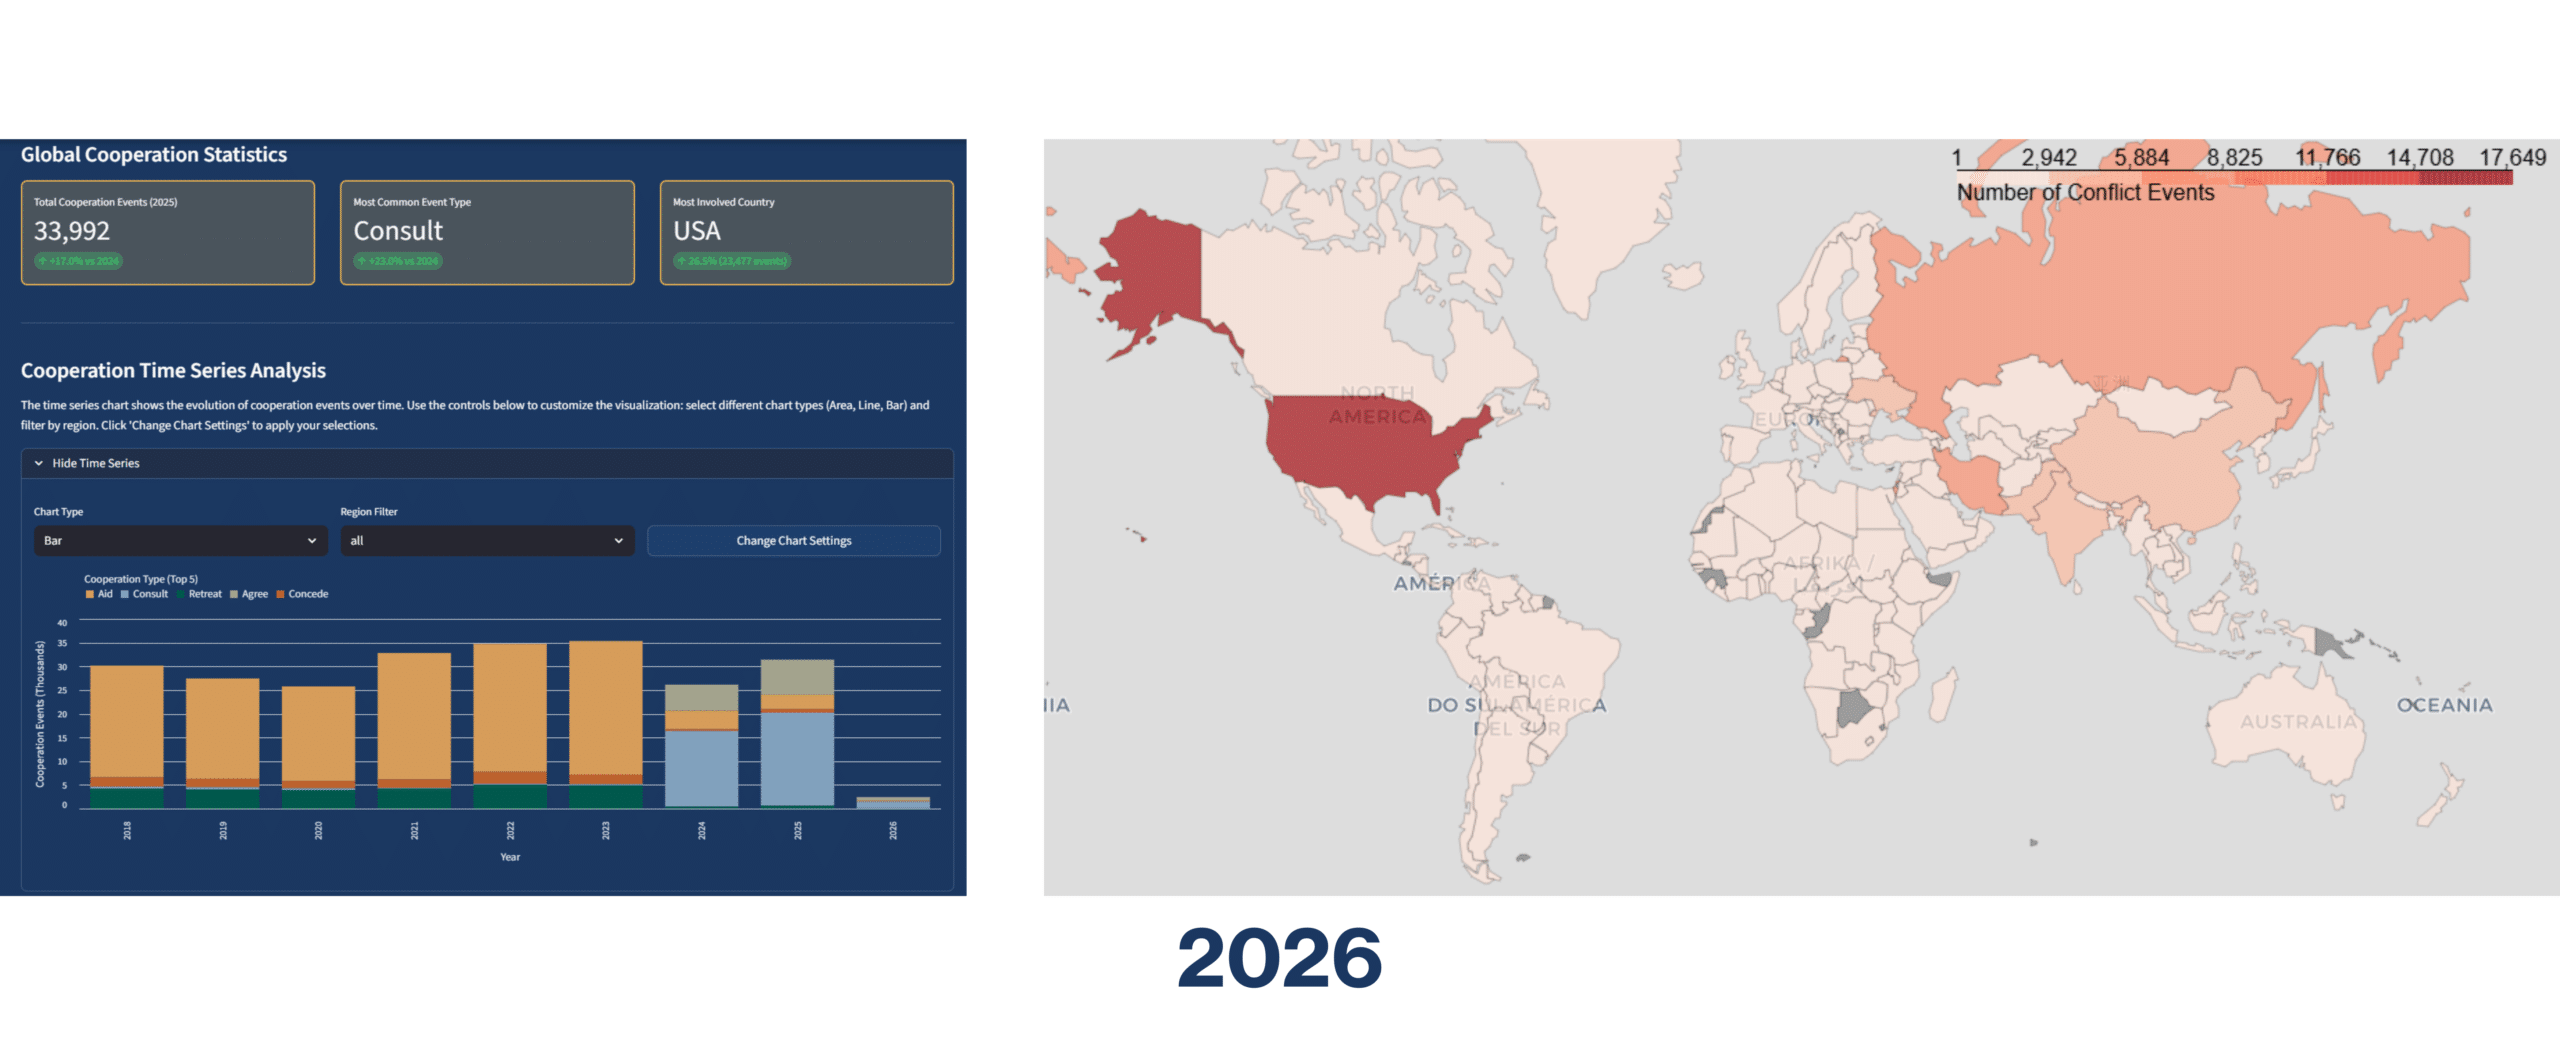
Users can explore two complementary networks: one capturing cooperative signalling patterns and another tracing conflictual signalling dynamics expressed through geopolitical events. This layered structure highlights where event types such as consultation, agreement, and support align with (or diverge from) accusation, coercion, sanctions, and escalation. Temporal coverage extends from 2018 to the present, combining POLECAT’s historical baseline with EDGAR’s continuously updated event stream.
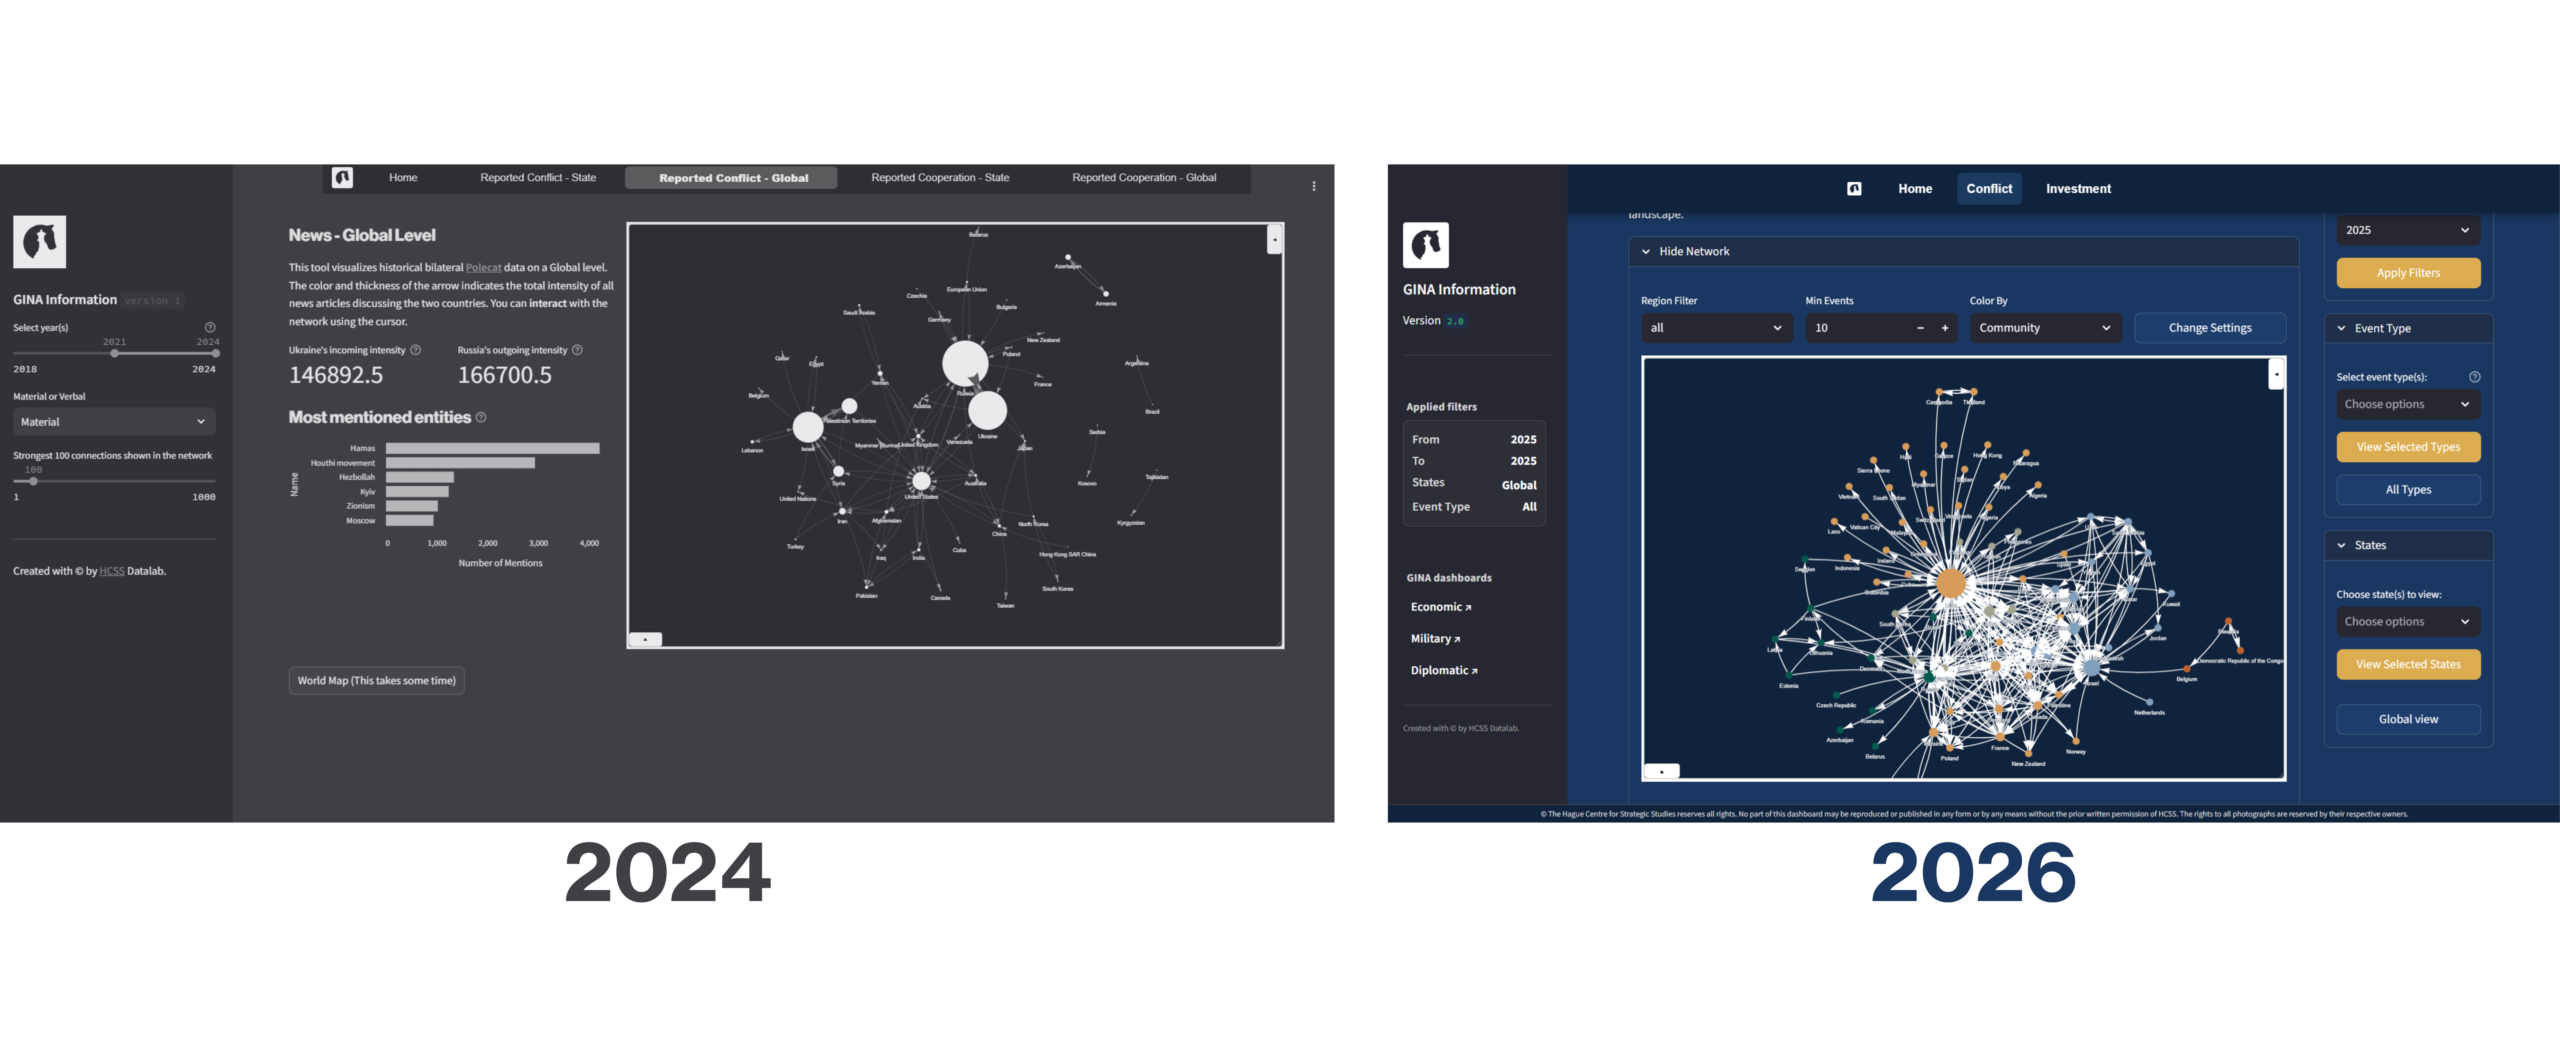
The platform features an interactive network and global map highlighting country-level involvement in cooperation and conflict, next to a temporal distribution of events and state profiles. Users can access aggregated statistics for selected periods and generate customisable time series to track trends changes in interaction intensity over time.
Watch the explainer video below, or go directly to the GINA Information landing page. If your organisation is interested in our GINA tools or contributing to their evolution, please contact us at datalab@hcss.nl or sign up for the GINA event on 17 February from 15.00 – 16.30, where the Datalab will give a live demo.


Related Content


