
As the Allied Defence Ministers are about to meet at NATO Headquarters in Brussels next week, Europe’s growing defence ambitions raise a difficult question: what is a fair way to share the burden of collective security? In this new analysis, HCSS research scientist Rens van Dam explores why equal defence spending targets may not reflect the realities of threat perception across Europe. Using a Lindahl model based on countries’ proximity to Moscow, the research suggests that states facing greater risks should contribute more. As Europe adapts to a reduced U.S. role in NATO, the debate is no longer only about spending more – but about how to distribute costs fairly and effectively.
This longread was written by Rens van Dam, based on recent research with Loek Groot on fair burden sharing within European NATO. You can find the full report here: Cooperative European NATO burden sharing under a Lindahl model.
With the United States pulling back, thinktanks are increasingly trying to answer the question of what a European NATO could look like without its big brother. At the institutional level, within NATO and the EU, this requires serious adjustments. Command structures need to be adapted.[1] The NATO Joint Force Commands (JFC), the highest military command centres of the alliance, have long been led by Americans but are currently being transferred to Europeans.[2] More transfers in domain-specific commands will need to occur. Furthermore, the relationship between the EU and NATO must be improved: stronger political commitment and more coordination in defence planning can strengthen the bond.[3] A more autonomous Europe, capable of making its own security choices, should be the goal – which does not mean that Europe needs to leave NATO. Does Europe, however, spend enough to get there?
When we compare the United States to the European countries, we see that both per capita spending on defence and the defence burden as a share of GDP are considerably lower in Europe. This is an indication of free-riding behaviour by the Europeans – and has been emphasised many times by the Americans, from the very beginning of the alliance.[4][5] Under the presidencies of Obama and Trump, this pressure has increased and concrete steps have been taken: at the Wales Summit in 2014, a goal of defence spending of 2% of GDP was agreed upon, and in 2025, in the presence of President Trump, this was raised to 3.5%, to be achieved by 2035.[6][7]
The numbers
It is useful to lay out the facts about the extent to which European countries and the U.S. spend on defence. There is no NATO country that spends as much per capita as the United States: 2,244 USD versus 593 USD on average among European NATO countries in 2024. As a percentage of GDP, it also stands firmly above the rest (Figure 1). Over the years, it has waged wars (Vietnam, Iraq/Afghanistan) that caused large variations, from 1,500 to over 2,500 dollars – while the average defence burden per capita in Europe has always been just above 500 dollars, far below American spending.
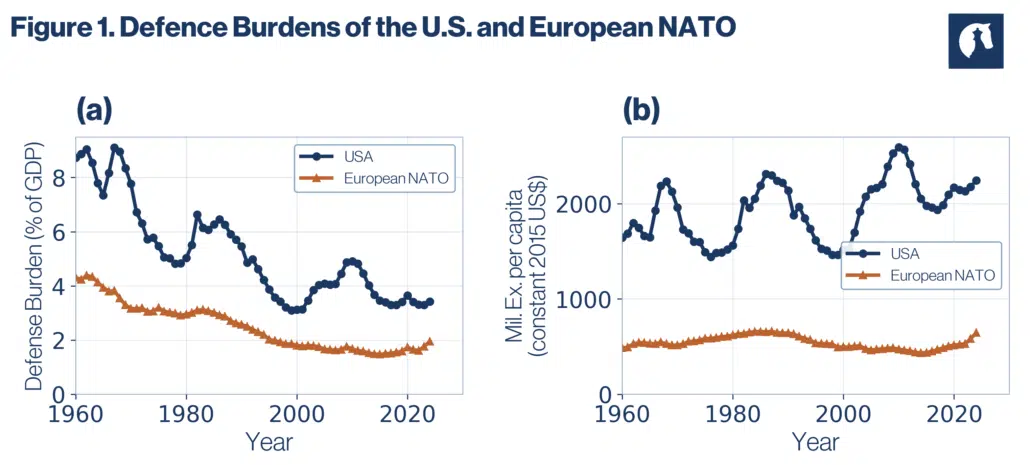
Figure 1. Defence Burdens of the U.S. and European NATO
In (a) defence burdens as % of GDP in constant 2015 USD and (b) military expenditure per capita in constant 2015 USD.
The European average is fairly constant. But how are the costs distributed within Europe? We can describe the variation in defence burdens as a percentage of GDP or per capita using the standard deviation from the mean (Figure 2). Since 1990, the average percentage of GDP spent on defence has decreased: the peace dividend. During this period, NATO has grown: since 1999, no fewer than 16 new countries have joined. At the same time, the variation in how much countries spend has decreased: countries in Europe are more uniform in their GDP spending. Now that spending must increase, the question is whether that uniformity will be maintained – in recent years, spending has already increased, but much faster in Eastern Europe than in Western Europe.
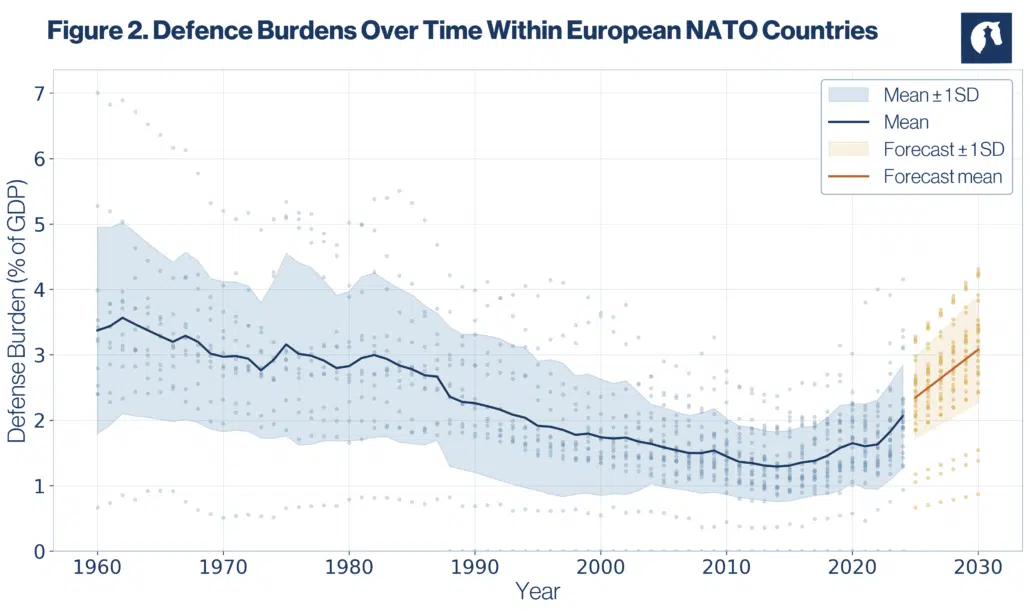
Figure 2. Defence Burdens Over Time Within European NATO Countries
What is fair?
It is by no means obvious why every country in the alliance should spend the same amount as a percentage of GDP on defence. The U.S. in particular does not use its military spending solely to strengthen (collective) security: over the years, the U.S. has undertaken many military operations primarily to maintain American primacy.[8] This suggests that an equal percentage of 2% or 3.5% of GDP on defence spending is therefore not by definition a fair share for every country in the alliance. Other measures – for example, military casualties in NATO operations per capita or troop deployment – can be considered and are good alternatives for determining a country’s ‘burden’.[9] However, these measures do not help to inform a fair economic burden distribution – they only provide better insights into the overall burdens that countries bear.
As a matter of fact, the question of how to distribute burdens within an alliance has kept scholars busy for a long time already. Collective security is characterized by indivisibility and non-excludability: benefiting from it does not diminish the amount of security, and if you are part of the alliance, you cannot be excluded from it. This also means there is an incentive for small states to free-ride and spend somewhat less on defence, because the others are spending on defence, which guarantees enough collective security.[10]
But – if an identical percentage of GDP is not per se the best solution – how then do we determine what countries pay and how do we assess whether countries are free-riding? One consideration could be to base the cost-sharing formula on countries’ willingness to pay. This was the idea of Swedish economist Erik Lindahl: one pays according to the degree to which one benefits from the good. In the recent research by Loek Groot and myself, we used proximity to Moscow as a proxy for a country’s threat perception, which determines the willingness for higher defence spending.[11] The underlying reasoning is that countries that have a greater stake in the alliance should pay more. This approach also has its problems, but it does challenge us to think differently about fair burden sharing.
In a Lindahl process, each country pays a cost share determined by its preference. In our research, this cost sharewas determined by GDP and proximity to Moscow. The expenditure of a country i is then calculated as
. In a Lindahl scenario, there is no free-riding: everyone pays according to their preference. The challenge for a Lindahl process is determining honest preferences.
In our research, we made a projection until 2035 for European defence spending, assuming that Europe-wide the 3.5% target is reached in 2035, with spending increasing linearly each year until then (shown in Figure 2 until 2030). We do not assume a cost distribution of a fixed percentage of GDP, but rather a Lindahl distribution based on threat perception. Table 1 shows the results of this projection for the years 2027, 2029, and 2035 for each country. Countries far from Moscow such as Portugal, Iceland, and Spain pay the least, while the Baltic states and Finland spend the most as a percentage of GDP. Notable is Poland, which is already nearly at the level where it should be in 2035 according to a Lindahl distribution, and also Germany, which lags behind the most in absolute terms.
The Road Ahead
It is beyond question that Europe will spend more on defence. How this spending will be distributed, however, is anything but clear. It would be naive to assume that all countries will adhere to the NATO target in the coming years. Therefore, thinking about which factors determine a country’s defence spending is of great importance. Our Lindahl model combines the spirit of cooperation in Europe with the threat perception of Russia to model defence spending.
Moreover, it should be clear that building a capable defence is more than spending a higher percentage of GDP on it. More money for defence also means great challenges in spending that money effectively. Can European industry handle the large demand? And if not, will it then (as the U.S. hopes) flow across the Atlantic Ocean to American industry?
Choices must be made not only on that front, but also within Europe. Do we see the landscape of defence companies in Europe as a ‘European industry’, or as a sum of national industries, all considered equally important by their respective governments? If a country then needs to spend more, it will prefer to do so in its own industry. This too is a factor that weighs on countries: where the money ends up. These considerations are not included in our Lindahl model – but should certainly be investigated further.
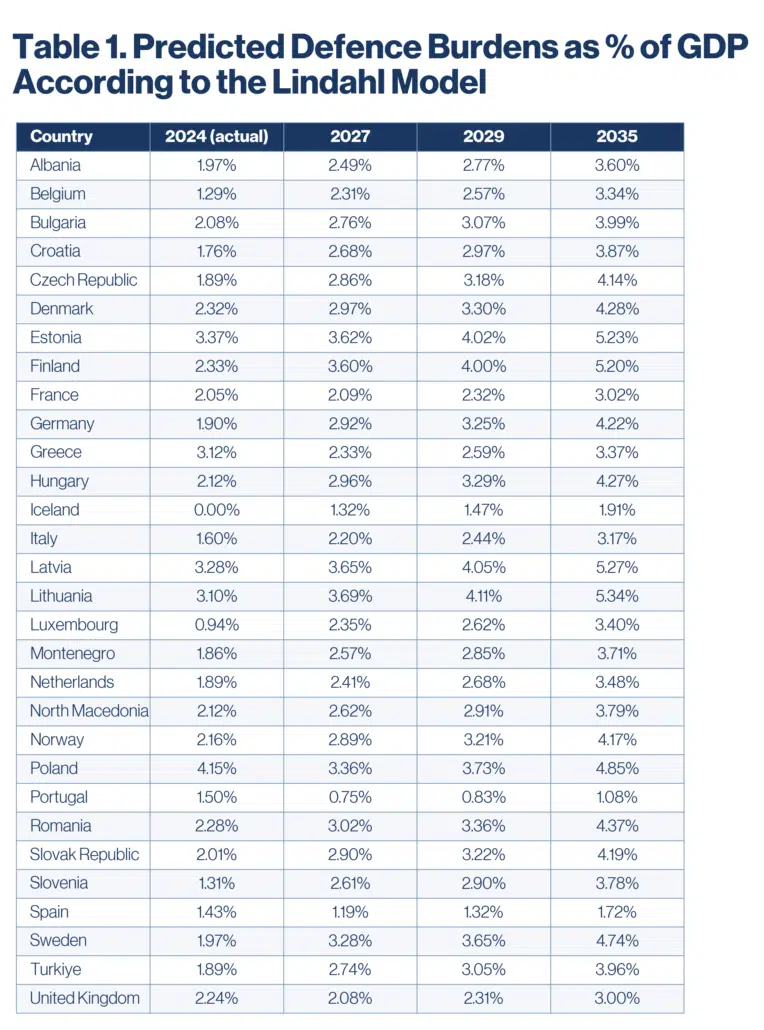
*GDP forecasts for 2025–2030 are from IMF World Economic Outlook; 2035 GDP is derived using the GDP growth rate in 2028–2030.
[1] Palmer, Diego Ruiz and Luis Simón (2025). “Rebalancing NATO’s Command: European Operational Responsibility and Transatlantic Defence”.
[2] NATO (2026). “European Allies to take on new leadership roles in NATO’s Command Structure” https://www.nato.int/en/news-and-events/articles/news/2026/02/06/european-allies-to-take-on-new-leadership-roles-in-natos-command-structure
[3] Ellison, Davis and Daniel Fiott (2026). “Between the Berlaymont and the Glass Palace: The relative roles of the European Union and NATO in European defence”.
[4] Hartley, Keith & Todd Sandler (1999). “NATO Burden-Sharing: Past and Future”, Journal of Peace Research.
[5] Creswell, Michael and Victor Gavin (2017). “A History of Vexation: Trump’s Bashing of NATO is Nothing New”.
[6] Wales Summit Declaration (2014).
[7] The Hague Summit Declaration (2025).
[8] Thimm, Johannes (2018). “NATO: Die ungleiche Lastenteilung ist die Kehrseite amerikanischer Vorherrschaft”.
[9] Bogers, Marion (2022). “Burden sharing in security organizations”.
[10] Olson, M. and Zeckhauser, R. (1966). An Economic Theory of Alliances. The Review of Economics and Statistics 48(3): 266–279.
[11] Van Dam, Rens and Loek Groot (2026). “Cooperative European NATO burden sharing under a Lindahl model“.
Experts

Related Content